All topics
Practice this topic

Strand 3: Interactions of Life

Ecology & Ecosystems

Ecosystems, biodiversity, population curves, energy flow, food webs, and ecological investigations.

3.1 Ecology & Biodiversity

In brief:Ecology is the study of the interactions between organisms and their environment. Biodiversity refers to the variety of life in a given area.

Ecology is the study of how organisms interact with each other and their environment.

Hierarchy of ecological organisation:
Biosphere → Ecosystem → Habitat → Community → Population → Individual Organism

Biodiversity is the variety of living organisms in an area. It can be measured using Simpson's Diversity Index:

Ds = 1 − Σn(n−1) / N(N−1)
Where n = number of individuals of each species, N = total number of all individuals
Result closer to 1.0 = high diversity, closer to 0 = low diversity

Factors affecting ecosystems:
Abiotic (non-living): temperature, light, water, soil pH, oxygen, space
Biotic (living): competition, predation, disease, food availability, parasitism

Population curves:
S-curve (sigmoid): population grows, then levels off at carrying capacity (limited resources)
J-curve: population grows exponentially with unlimited resources (unsustainable)

Carrying capacity is the maximum population size that an environment can sustain indefinitely, determined by limiting factors.
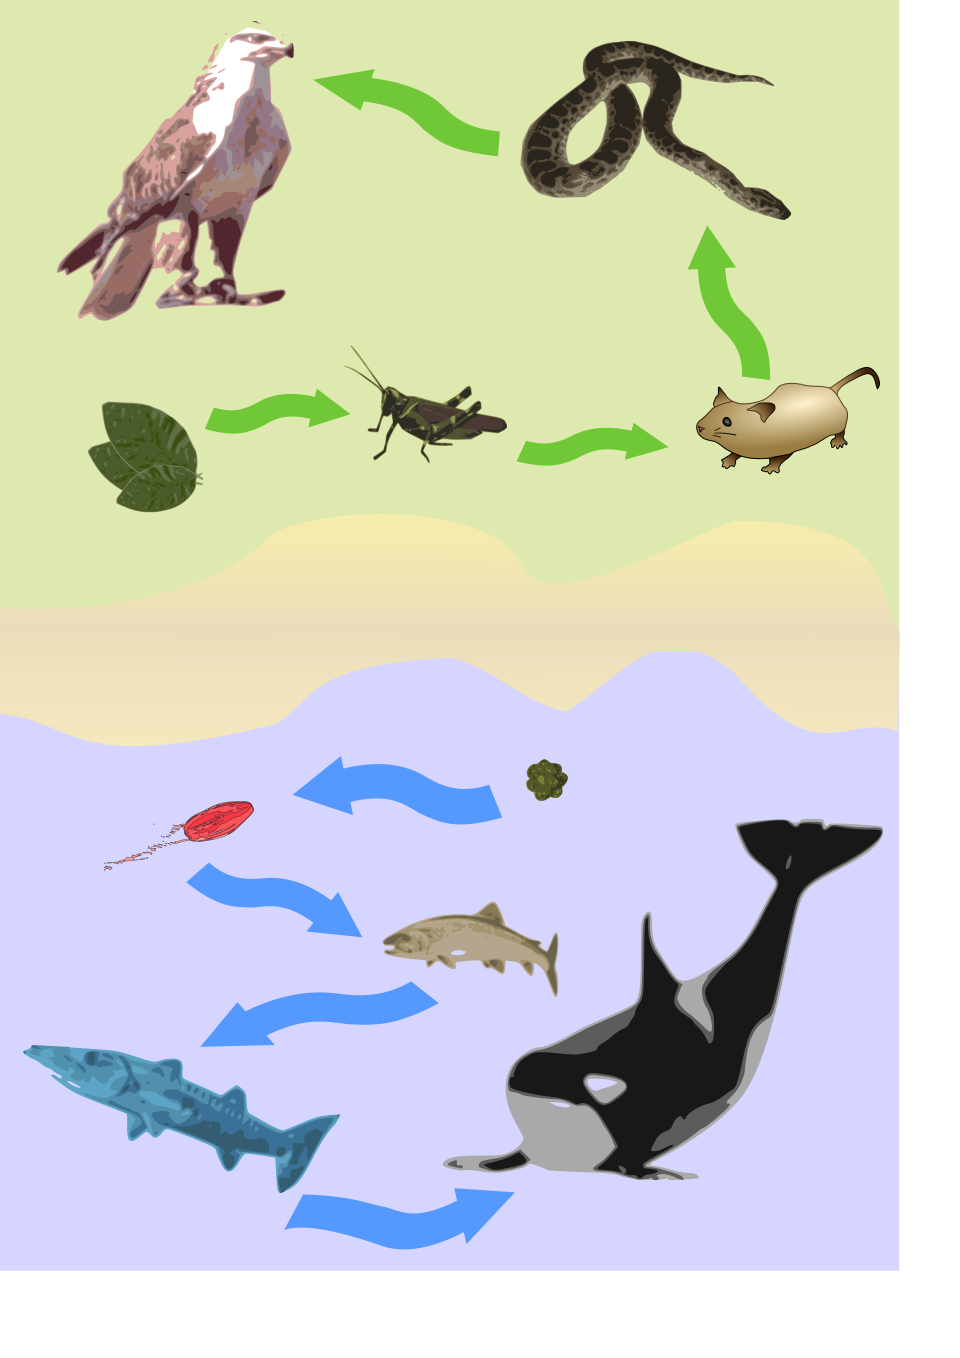
Food chain

A simple food chain showing energy flow

Wikimedia Commons (CC)
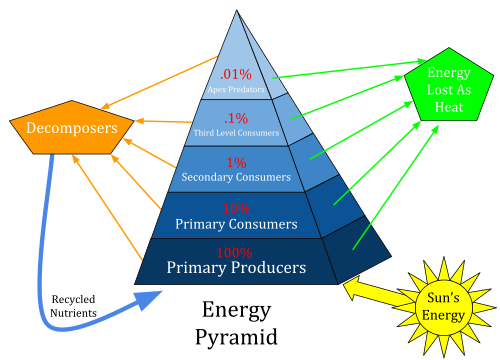
Ecological pyramid

Pyramid of numbers / energy across trophic levels

Wikimedia Commons (CC)

equation

Simpson's Diversity Index

Ds = 1 − Σ n(n−1) / N(N−1)

n = individuals per species  |  N = total individuals  |  Closer to 1.0 = more diverse

process

Ecological Hierarchy

Biosphere
Ecosystem
Habitat
Community
Population
Organism

Key Points

  • 1Biosphere > Ecosystem > Habitat > Community > Population > Organism.
  • 2Biodiversity loss has environmental, economic, social, and cultural impacts.
  • 3Simpson's Diversity Index: Ds = 1 − Σn(n−1) / N(N−1). Higher = more diverse.
  • 4Abiotic factors: water, oxygen, space, temperature, soil.
  • 5Biotic factors: food, disease, competition, predation.
  • 6Carrying capacity: maximum population an environment can sustain.
  • 7S-curve: population in resource-limited environment. J-curve: unlimited resources.
  • 8Niche: the role and position of an organism within its ecosystem.

Learning Outcomes

  • Outline what is meant by the biosphere, ecosystems, habitats, biodiversity
  • Discuss the impact of biodiversity loss in local ecosystems and the important role conservation plays in limiting biodiversity loss
  • Evaluate primary or secondary data relating to the effects of human activity on species diversity
  • Model species diversity in ecosystems using the Simpson's Diversity Index equation
  • Illustrate how limiting factors determine the carrying capacity for species in Irish ecosystems

2. Carrying Capacity, S-Curves and J-Curves

In brief:Populations grow until limiting factors stop them. The S-curve levels off at the carrying capacity; the J-curve overshoots and crashes.

Carrying capacity

The carrying capacity (K) of a habitat is the maximum population size of a species that the environment can support indefinitely. It is set by limiting factors: food, water, space, nesting sites, light and minerals for plants, plus predators, disease and competition.

The S-curve (sigmoid)

A population introduced to a new habitat shows four phases. In the lag phase numbers grow slowly while individuals establish. In the log (exponential) phase resources are plentiful and numbers rise rapidly. As resources run short, births and deaths come into balance in the stationary phase, so the curve levels off at the carrying capacity and then fluctuates around it. Most natural populations follow this pattern.

The J-curve

A J-curve shows exponential growth that continues unchecked, followed by a sudden crash when a resource runs out or waste builds up. Algal blooms after fertiliser run-off, locust swarms and bacteria in a sealed flask all show this pattern. The population overshoots the carrying capacity, which can damage the habitat and lower K for the future.

Irish examples

Rabbit populations rise and fall with grass growth, fox numbers, and disease such as myxomatosis. Grey squirrels expanded rapidly after introduction and are now limited by pine marten predation in parts of the midlands. Fish stocks off the coast are held below carrying capacity by fishing pressure, and deer in enclosed parkland exceed it without culling, damaging the woodland they depend on.

svg

S-shaped and J-shaped population growth curves

carrying capacity (K) S-curve (sigmoid) lag → rapid growth → levels off as limiting factors act (food, space, predators) J-curve unlimited growth then a sudden crash when resources run out (algal bloom, locusts) Number of individuals plotted against time

Key Points

  • 1Carrying capacity: the maximum population an environment can support indefinitely
  • 2Limiting factors include food, space, water, predators, disease and competition
  • 3S-curve: lag, log, stationary phases, levelling off at the carrying capacity
  • 4J-curve: unchecked exponential growth followed by a population crash
  • 5Irish examples: rabbits and disease, grey squirrel and pine marten, deer without culling

Learning Outcomes

  • Illustrate how limiting factors determine the carrying capacity for species in Irish ecosystems
  • Interpret S-population and J-population curves

3. Pyramids of Numbers and Biomass

In brief:Ecological pyramids show what happens at each trophic level; the pyramid of biomass shows the loss of material and energy up the food chain.

Pyramid of biomass

A pyramid of biomass shows the total dry mass of living material at each trophic level, usually per square metre. Producers form the wide base, and each level above is smaller. The reason is that only about 10% of the energy at one level becomes biomass at the next: the rest is lost as heat from respiration, in movement, and in undigested material, urine and faeces.

This 10% rule explains why food chains are rarely longer than four or five links - there is simply not enough energy left to support another level - and why more people can be fed from a given area of crops than from animals raised on the same land.

Pyramid of numbers

A pyramid of numbers counts individuals instead of measuring mass, so it can end up inverted: a single oak tree supports thousands of caterpillars. A pyramid of biomass corrects this, because that one tree has an enormous mass.

When biomass pyramids invert

In open water, phytoplankton have a small standing biomass at any moment but reproduce extremely fast, so they can support a larger mass of zooplankton. Measuring productivity (biomass produced per unit time) rather than standing biomass gives an upright pyramid again.

Dry mass is used because water content varies and adds no energy. Obtaining it means drying samples to constant mass, which kills the organisms, so pyramids are usually built from sampled estimates.

svg

Pyramid of biomass

Producers - grass 800 g/m² Primary consumers - rabbits 120 g/m² Secondary consumers - foxes 20 g/m² Top carnivore - eagle 4 g/m² Pyramid of biomass (dry mass per unit area at each trophic level) Biomass falls at each level because energy is lost as heat, in respiration and in undigested waste - only about 10% passes on.

Key Points

  • 1A pyramid of biomass shows the dry mass of organisms at each trophic level
  • 2About 10% of energy passes to the next level; the rest is lost as heat, movement and waste
  • 3This limits food chains to about four or five trophic levels
  • 4Pyramids of numbers can be inverted (one tree, many insects); biomass pyramids usually are not
  • 5Plankton give an inverted biomass pyramid because of their rapid turnover

Learning Outcomes

  • Construct and interpret pyramids of numbers and pyramids of biomass

4. Niche, Competition and Energy Loss Between Trophic Levels

In brief:Energy is lost at every step of a food chain, and no two species can occupy exactly the same niche for long.

A niche is the functional role of an organism in its ecosystem: what it eats, what eats it, where and when it is active, and how it interacts with everything around it. It is more than a habitat, which is simply where it lives.

If two species occupy the same niche in the same place, one will out-compete the other. This is competitive exclusion. In practice species survive together by niche differentiation, for example feeding at different heights of a hedgerow or being active at different times of day.

Competition

Intraspecific competition is between members of the same species, and it is the more intense kind because their needs are identical. Interspecific competition is between different species over a shared resource. Both are density-dependent limiting factors: as the population rises, competition increases and growth slows, which is what produces the flattening of an S-shaped growth curve at the carrying capacity.

Energy transfer and its losses

Energy enters an ecosystem as sunlight, and producers convert only about 1% of the light falling on them into chemical energy. Moving from one trophic level to the next, only about 10% of the energy is passed on. The other 90% is lost as:

  • heat released by respiration,
  • energy in undigested material lost in faeces,
  • energy in nitrogenous excretion such as urea,
  • parts not eaten, such as bone, roots and bark.

This is why food chains are rarely longer than four or five links: there is not enough energy left to support another level. It is also why a given area of land feeds far more people growing crops than raising cattle.

Exam tip

When you are asked why food chains are short, answer in terms of energy loss at each transfer, and name the routes of loss: respiration, faeces, excretion and uneaten parts.

Key Points

  • 1A niche is the functional role of a species, not just where it lives
  • 2Two species cannot occupy the same niche indefinitely: competitive exclusion
  • 3Intraspecific competition is more intense than interspecific competition
  • 4About 10% of energy passes to the next trophic level; the rest is lost in respiration, faeces, excretion and uneaten parts
  • 5Short food chains are a direct consequence of that energy loss

Learning Outcomes

  • Outline the concept of the niche
  • Consider how nutrients are transferred between trophic levels, taking account of energy loss at each level
  • Explain the effects of intraspecific and interspecific competition on populations

Interactive: Food Web Builder

Construct a food web and see how energy flows through trophic levels.

Food Web & Energy Pyramid

Tertiary consumers (top predators)~ 10 kJ
Add an organism to level 4...
Secondary consumers~ 100 kJ
Add an organism to level 3...
Primary consumers (herbivores)~ 1,000 kJ
Add an organism to level 2...
Producers (autotrophs)~ 10,000 kJ
Add an organism to level 1...
Tap organisms on the right to build a food web.
Organisms