All topics
Practice this topic

Unifying Strand

Nature of Science

How scientific knowledge evolves, the scientific method, peer review, bias, and data analysis.

1. How Scientific Knowledge Evolves

In brief:Scientific knowledge is not fixed - it changes as new evidence emerges and better tools become available.

Science is a dynamic, evolving process. What we consider 'scientific knowledge' today may be revised tomorrow as new evidence emerges or better technology becomes available.

A key example is the shift from Spontaneous Generation (the idea that life arises from non-living matter, e.g. maggots from rotting meat) to Germ Theory (diseases are caused by specific microorganisms). Louis Pasteur's famous swan-neck flask experiment in the 1860s finally disproved spontaneous generation.

Similarly, the Miasma Theory ('bad air' caused disease) was replaced when scientists like John Snow traced a cholera outbreak to a contaminated water pump in London (1854), showing disease spread through water, not air.

Accidental discoveries (serendipity) have transformed science - Alexander Fleming noticed mould killing bacteria on a petri dish in 1928, leading to the discovery of penicillin, the first antibiotic.

Technology drives science forward: the microscope revealed cells (Robert Hooke, 1665), and modern DNA sequencing has unlocked genomics and personalised medicine.
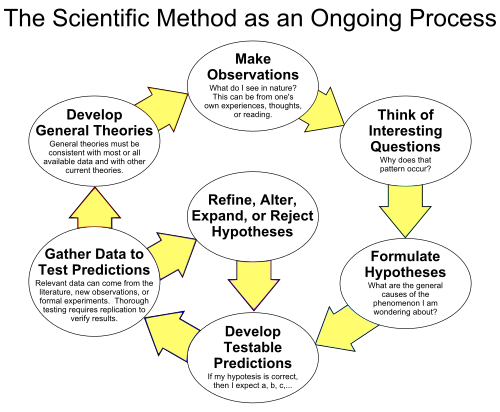
Scientific method flowchart

The scientific method as an ongoing process

Wikimedia Commons (CC)

process

How Scientific Knowledge Evolves

Observation
Question
Hypothesis
Investigation
Evidence
Revised Theory
table

Key Theory Changes in Biology

Old TheoryNew TheoryKey ScientistEvidence
Spontaneous GenerationBiogenesis (life from life)Louis PasteurSwan-neck flask experiment
Miasma TheoryGerm TheoryJohn Snow / Robert KochCholera linked to water, not air
Fixed speciesEvolution by Natural SelectionCharles DarwinFossil record, finch variations

Key Points

  • 1Observations lead to questions, which lead to investigations and revised theories.
  • 2Spontaneous generation was disproved by Pasteur and replaced by Germ Theory.
  • 3'Bad air' (miasma) was once thought to cause cholera; Germ Theory identified microorganisms as the cause.
  • 4Technological advances (e.g. the microscope, DNA sequencing) unlock new areas of investigation.
  • 5Accidental discoveries can change science - e.g. Fleming's discovery of penicillin.

Learning Outcomes

  • Appreciate how scientists work and how scientific ideas are modified over time

2. The Scientific Community

In brief:Science is a global, collaborative enterprise. Researchers worldwide share findings, challenge each other's work, and build on collective knowledge.

Science is not done in isolation - it is a global, collaborative enterprise. Researchers worldwide share findings through journals, conferences, and digital platforms.

The Human Genome Project (1990–2003) is a landmark example: 2,800+ scientists from 20 institutions across 6 countries worked together to sequence the entire human genome (3 billion base pairs). This collaboration revealed that humans share 99.9% of their DNA.

Modern science increasingly relies on international collaboration - COVID-19 vaccine development involved scientists from dozens of countries sharing data in real time, leading to vaccines in under 12 months (compared to the usual 10-15 years).

Key Points

  • 1The scientific community is a worldwide network of researchers who collaborate and share findings.
  • 2Scientists publish in journals, present at conferences, and work across institutions.
  • 3The Human Genome Project involved 2,800+ scientists from 20 institutions across 6 countries.

Learning Outcomes

  • Appreciate how scientists work and how scientific ideas are modified over time

3. Peer Review & Reproducibility

In brief:Before research is published, it is evaluated by independent experts. Reproducibility means other scientists can repeat the work and get the same results.

Before any research is published in a scientific journal, it undergoes peer review - a rigorous evaluation by independent experts in the field.

The Peer Review Process:

1. Researcher submits paper to a journal
2. Editor sends it to 2-3 independent experts (reviewers)
3. Reviewers check: experimental design, data analysis, conclusions, bias, plagiarism
4. Reviewers recommend: accept, revise, or reject
5. If accepted after revisions, the paper is published

Repeatability vs Reproducibility:

Repeatability: the same researcher, under identical conditions, gets the same results
Reproducibility: different researchers, in different labs, following the published method, get the same results

A test-retest correlation of +0.80 or above indicates good reliability. To improve reliability: publish detailed methods, use repeated trials, and increase sample size.

process

The Peer Review Pipeline

Submit Paper
Expert Review
Revisions
Published
comparison

Repeatability vs Reproducibility

Repeatability
  • Same researcher
  • Same lab & equipment
  • Same conditions
  • Same results
Reproducibility
  • Different researchers
  • Different labs
  • Following published method
  • Same results

Key Points

  • 1Peer review: experts check design, accuracy, bias, and plagiarism before publication.
  • 2Ensures published research is valid, credible, and free from significant errors.
  • 3Repeatability: same researcher, same conditions, same results.
  • 4Reproducibility: different researchers, different labs, same results.
  • 5A test-retest correlation of +0.80 or above indicates good reliability.
  • 6Publish detailed methods so others can replicate; use repeated trials and larger samples.

Learning Outcomes

  • Appreciate how scientists work and how scientific ideas are modified over time
  • Design, plan and conduct investigations; explain how reliability, accuracy, precision, error, fairness, safety, integrity, and the selection of suitable equipment have been considered

4. Bias in Data

In brief:Bias occurs when systematic errors skew results away from the true picture. It can arise at every stage of an investigation.

Bias is any systematic error that skews results away from the truth. It can occur at every stage of an investigation - from sample selection to data analysis to reporting.

Types of Bias:

Sample bias: the sample doesn't represent the population. E.g. surveying only one school about favourite subjects
Confirmation bias: researchers only look for evidence that supports their hypothesis
Analysis bias: fabricating data, omitting inconvenient results, using misleading graphs
Publication bias: journals prefer to publish positive results, not negative ones

Recognising Graph Manipulation: A truncated y-axis (one that doesn't start at zero) can make small differences appear dramatic. Always check the axis scale when reading scientific graphs.

Reducing Bias: Use random sampling, blind/double-blind designs, peer review, and check: Who funded the study? Are all results reported? Is the source peer-reviewed?

Key Points

  • 1Sample bias: sample doesn't represent the population.
  • 2Representative sample mirrors the key characteristics of the whole population.
  • 3Random selection gives every member an equal chance of being selected.
  • 4Analysis bias: fabricating data, omitting results, using inappropriate graphs.
  • 5Truncating the y-axis exaggerates differences - a common form of visual bias.
  • 6Always check: Is the source peer-reviewed? Who funded the study? Are all results reported?

Learning Outcomes

  • Conduct research relevant to a scientific issue, evaluate different sources of information including secondary data, understanding that a source may lack detail or show bias
  • Evaluate media-based arguments concerning science and technology

5. The Scientific Method

In brief:The scientific method is a systematic approach to investigating questions through observation, hypothesis, experimentation and conclusion.

The scientific method is the systematic approach used by scientists to investigate questions about the natural world. It provides a logical framework for testing ideas and drawing conclusions.

A hypothesis must be:
Testable - can be investigated through experiment
Falsifiable - can potentially be proven wrong
• Written as a clear, predictive statement (not just a guess)

Variables explained:
Independent variable (IV): what the scientist deliberately changes
Dependent variable (DV): what is measured in response
Controlled variables (CVs): everything kept constant for a fair test

Example: Testing if caffeine affects heart rate - IV: dose of caffeine, DV: heart rate, CVs: age, gender, resting period, time of day.

Controls in Medical Trials:
Control group: receives no treatment (or a placebo)
Placebo: a fake treatment that looks identical to the real one
Double-blind design: neither participants nor researchers know who receives the real treatment - eliminates expectation bias from both sides

process

Steps of the Scientific Method

Observe
Question
Hypothesise
Experiment
Analyse
Conclude
table

Variables in an Experiment

Variable TypeRoleExample (Caffeine & Heart Rate)
Independent (IV)What is changedDose of caffeine (0mg, 50mg, 100mg)
Dependent (DV)What is measuredHeart rate (bpm)
Controlled (CVs)What stays the sameAge, gender, resting period, time of day

Key Points

  • 1Observation → Hypothesis → Experiment → Analyse → Conclude.
  • 2A hypothesis must be testable, falsifiable, and written as a clear statement.
  • 3Independent variable: what the scientist deliberately changes.
  • 4Dependent variable: what is measured in response.
  • 5Controlled variables: kept constant for a fair test.
  • 6Control group: does not receive the independent variable, used as baseline.
  • 7Placebo: a fake treatment given to the control group in medical trials.
  • 8Double-blind: neither participants nor researchers know who gets real treatment.

Learning Outcomes

  • Recognise questions that are appropriate for scientific investigation
  • Pose testable hypotheses developed using scientific theories and explanations, and evaluate and compare strategies for investigating hypotheses
  • Design, plan and conduct investigations; explain how reliability, accuracy, precision, error, fairness, safety, integrity, and the selection of suitable equipment have been considered

6. Accuracy, Precision & Validity

In brief:Understanding the quality of measurements and investigations is essential for reliable scientific work.

Understanding measurement quality is critical. Three related but different concepts:

Accuracy = how close your result is to the true value. Like hitting the bullseye on a target.

Precision = how close your repeated measurements are to each other. Like hitting the same spot repeatedly (even if it's not the bullseye).

Validity = does the investigation actually measure what it claims to? A valid experiment has proper controls, a representative sample, and calibrated instruments.

Think of it as a target:
• High accuracy + high precision = all arrows in the bullseye
• High precision + low accuracy = arrows clustered together but off-centre
• Low precision + low accuracy = arrows scattered everywhere

comparison

Accuracy vs Precision - The Target Analogy

Accurate & Precise
  • All results near true value
  • Results consistent with each other
  • The ideal outcome
Precise but NOT Accurate
  • Results consistent with each other
  • But systematically off from true value
  • Suggests systematic error

Key Points

  • 1Accuracy: how close a measurement is to the true value.
  • 2Precision: how consistent repeated measurements are with one another.
  • 3Validity: whether the investigation actually measures what it intends to.
  • 4Use proper controls, representative samples, and calibrated instruments to ensure validity.

Learning Outcomes

  • Design, plan and conduct investigations; explain how reliability, accuracy, precision, error, fairness, safety, integrity, and the selection of suitable equipment have been considered

7. Data, Uncertainty & Error

In brief:Understanding types of data and sources of error is critical for evaluating scientific investigations.

Data can be qualitative (descriptive observations like colour change, smell) or quantitative (numerical measurements like temperature in °C, mass in grams).

Anomalous data (outliers) are results that don't fit the pattern. They should be excluded from averages but always reported and explained - never deleted silently.

Two types of error:

Systematic error: a consistent, predictable deviation from the true value. Affects accuracy. Caused by faulty equipment, calibration errors, or flawed method. E.g. a balance that always reads 0.5g too high.
Random (statistical) error: unpredictable variation between measurements. Affects precision. Caused by natural variation, human reaction time. Reduced by increasing sample size and repeating trials.

comparison

Systematic Error vs Random Error

Systematic Error
  • Consistent deviation
  • Affects accuracy
  • Same direction each time
  • Fix: recalibrate equipment
Random Error
  • Unpredictable variation
  • Affects precision
  • Varies in direction
  • Fix: more repeats, larger sample

Key Points

  • 1Qualitative data: non-numerical observations (e.g. colour change).
  • 2Quantitative data: numerical measurements (e.g. temperature in °C).
  • 3Anomalous data: doesn't fit the pattern; exclude from averages but report.
  • 4Systematic error: consistent deviation, affects accuracy (faulty equipment).
  • 5Statistical (random) error: unpredictable variation, affects precision.
  • 6Reduce random error by increasing sample size and repeating trials.

Learning Outcomes

  • Design, plan and conduct investigations; explain how reliability, accuracy, precision, error, fairness, safety, integrity, and the selection of suitable equipment have been considered
  • Produce and select data (qualitatively/quantitatively), critically analyse data to identify patterns and relationships, identify anomalous observations, draw and justify conclusions

8. Correlation & Causation

In brief:A key skill is distinguishing between correlation (two variables changing together) and causation (one directly causing the other).

Key Points

  • 1Correlation: a statistical relationship - as one variable changes, the other tends to change.
  • 2Causation: one variable directly causes a change in the other.
  • 3Correlation does NOT equal causation - e.g. ice cream sales and shark attacks.
  • 4Correlation coefficient (r): +1.0 (strong positive) to −1.0 (strong negative); 0 = no correlation.
  • 5Controlled experiments are needed to establish causation.

Learning Outcomes

  • Produce and select data (qualitatively/quantitatively), critically analyse data to identify patterns and relationships, identify anomalous observations, draw and justify conclusions
  • Evaluate media-based arguments concerning science and technology

9. Evaluating & Communicating

In brief:Scientists must evaluate their findings critically and communicate them effectively through appropriate channels.

Evaluating results is a core scientific skill. After collecting data you should:

  • Compare the data to your hypothesis - was it supported, partially supported, or refuted?
  • Identify sources of systematic and random error and estimate their likely impact.
  • Suggest specific improvements - e.g. more precise instruments, a larger sample, better controls.
  • Compare your results to published literature values or pooled class data to assess consistency.

Communicating results takes many forms, each with a different purpose and audience:

  • Peer-reviewed journals - detailed articles describing methods, results and conclusions; evaluated by expert reviewers before publication.
  • Conferences - presentations and posters that enable face-to-face discussion among scientists.
  • Preprints - papers shared online before peer review to speed up communication (common during COVID-19).
  • Popular media - news articles, blogs and social media that translate findings for the public but may oversimplify.

Always work safely and ethically: complete a risk assessment, wear appropriate PPE, dispose of waste correctly, and cite the work of others honestly.

table

Channels for Communicating Science

ChannelAudienceStrengthsLimitations
Peer-reviewed journalScientistsRigorous, credible, detailedSlow; often paywalled
Conference talk / posterScientistsFast feedback, networkingLimited depth; not peer-reviewed
Preprint serverScientistsVery fast sharingNot yet peer-reviewed
News / social mediaGeneral publicWide reach, accessibleMay oversimplify or sensationalise

Key Points

  • 1Compare data to the hypothesis - supported, partially supported, or refuted?
  • 2Identify sources of error and suggest specific improvements.
  • 3Communication channels: journals, conferences, preprints, media.
  • 4Organise findings using relevant scientific terminology and representations.
  • 5Safety: conduct risk assessments, use PPE, plan waste disposal.

Learning Outcomes

  • Organise and communicate their research and investigative findings in a variety of ways fit for purpose and audience, using relevant scientific terminology and representations
  • Evaluate media-based arguments concerning science and technology
  • Research and present information on the contribution that scientists make to scientific discovery and invention, and evaluate its impact on society

10. Exam-Style Practice Questions

In brief:Apply what you've learned about the Nature of Science with these exam-style questions covering hypotheses, variables, peer review and error.

Work through each question in full sentences, then check your answer against the model answer and marking points that follow it.

Question 1 (15 marks) - A student investigates whether a new fertiliser increases crop yield.

  1. Write a suitable hypothesis for this investigation. (3)
  2. Identify the independent and dependent variables. (4)
  3. Name two controlled variables and explain why controlling them is important. (5)
  4. The student repeats each condition three times and calculates an average. Explain how this improves the reliability of the results. (3)
Model answer & marking points - Question 1
  1. Hypothesis (3): "Crop plants grown with the new fertiliser will produce a greater yield (mass of crop per plant) than plants grown without it." Marks: 1 - testable statement; 1 - links IV (fertiliser) to DV (yield); 1 - predicts a direction/outcome.
  2. Variables (4): Independent variable = presence/amount of the new fertiliser applied. Dependent variable = crop yield (e.g. mass or number of crops per plant). Marks: 2 - correctly named IV; 2 - correctly named DV with unit or measure.
  3. Controlled variables (5): Any two of - same plant species/variety, same volume of water, same soil type, same light intensity, same temperature. Controlling them ensures that any change in yield is caused only by the fertiliser and not by another factor, making it a fair test. Marks: 2 - two valid controlled variables (1 each); 3 - explanation that it isolates the effect of the IV / makes it a fair test.
  4. Reliability (3): Repeating each condition three times and calculating an average reduces the effect of random errors and identifies anomalous results, so the mean value is a more trustworthy estimate of the true effect. Marks: 1 - reduces random error; 1 - averages out anomalies; 1 - result is more representative/reliable.

Question 2 (14 marks) - A researcher publishes a study claiming that a new probiotic supplement reduces blood pressure in adults aged 40-50.

  1. What is meant by 'peer review'? State one benefit of the peer review process. (4)
  2. The study used a sample of 12 participants, all from the same city. Suggest two reasons why these results may not be reliable. (4)
  3. Distinguish between a systematic error and a statistical (random) error. Give one way to reduce each type. (6)
Model answer & marking points - Question 2
  1. Peer review (4): Peer review is the process where independent experts in the same field evaluate a research paper for its methods, results and conclusions before it is published. A benefit is that it filters out flawed or biased work, so published findings are more trustworthy. Marks: 2 - definition (independent experts / check quality before publication); 2 - valid benefit (e.g. improves reliability, detects errors or bias).
  2. Sample limitations (4): (i) The sample size of 12 is very small, so results may be due to chance and cannot be generalised. (ii) All participants are from one city, so the sample is not representative of the wider population (different diets, lifestyles, genetics). Marks: 2 for each valid reason with brief explanation.
  3. Errors (6): A systematic error is a consistent, repeatable error caused by a fault in the method or equipment (e.g. an uncalibrated blood-pressure monitor reading 5 mmHg too high every time). It is reduced by calibrating equipment and reviewing the procedure. A random (statistical) error is an unpredictable variation between measurements (e.g. slight changes in participant posture). It is reduced by repeating measurements and taking a mean. Marks: 1 - definition of systematic; 1 - example; 1 - way to reduce (calibration); 1 - definition of random; 1 - example; 1 - way to reduce (repeat & average).

Question 3 (11 marks) - A study finds a positive correlation between the number of hours students spend on social media and their reported anxiety levels.

  1. Explain the difference between correlation and causation. (4)
  2. Suggest one confounding variable that might explain this correlation. (3)
  3. Describe how a controlled experiment could help establish whether social media causes anxiety. (4)
Model answer & marking points - Question 3
  1. Correlation vs causation (4): A correlation means that two variables change together (as one increases, the other tends to increase or decrease), but this does not prove that one causes the other. Causation means that a change in one variable directly produces a change in the other, and requires evidence of a mechanism from a controlled experiment. Marks: 2 - correlation defined as an association/pattern; 2 - causation defined as a direct causal link needing controlled evidence.
  2. Confounding variable (3): Any one reasonable variable that could influence both, e.g. poor sleep quality (reduces sleep and increases both social-media use and anxiety), academic stress, or underlying mental-health conditions. Marks: 1 - names a plausible variable; 2 - explains how it influences both social-media use and anxiety.
  3. Controlled experiment (4): Randomly assign a large, representative sample of students into two groups. The experimental group has their daily social-media use limited to a set amount; the control group continues normal use. Keep other variables (age, school workload, sleep advice) as similar as possible. Measure anxiety levels using a standard scale before and after a fixed time period, and compare the mean change between groups. Marks: 1 - random allocation to control and experimental groups; 1 - IV clearly manipulated (social-media time); 1 - controlled variables kept constant; 1 - DV (anxiety) measured with a standard tool and results compared.
table

Marking Points - Quick Reference

SkillWhat examiners look for
HypothesisTestable statement linking IV and DV; predicts an outcome; falsifiable
VariablesIV changed, DV measured, controlled variables kept constant
ReliabilityRepeats, averages, larger sample, standardised method
Peer reviewIndependent experts check design, analysis and bias before publication
ErrorsSystematic = consistent bias (calibration); random = unpredictable (repeat + average)
Correlation vs causationCorrelation = association; causation requires controlled experiment and mechanism

Key Points

  • 1Every hypothesis must be a clear, testable statement linking two variables.
  • 2Controlled variables ensure any observed effect is due only to the independent variable.
  • 3Small, unrepresentative samples reduce reliability - repeat trials and increase sample size.
  • 4Systematic errors are reduced by calibrating equipment; random errors by repeating and averaging.
  • 5Correlation does not prove causation - a controlled experiment is needed to establish cause.

Learning Outcomes

  • Design, plan and conduct investigations; explain how reliability, accuracy, precision, error, fairness, safety, integrity, and the selection of suitable equipment have been considered
  • Produce and select data, critically analyse data to identify patterns and relationships, identify anomalous observations, draw and justify conclusions
  • Evaluate media-based arguments concerning science and technology